
Read the labels before reading the trend
In Google's Performance report, clicks count clicks from Search to your site. Impressions describe appearances in search results under Google's counting rules. Click-through rate is clicks divided by impressions. Average position summarizes the topmost result across the reported impressions. None of these is a direct count of sales, unique customers or profit.
Write the property, search type, dates and any active filters above the numbers you export. A report filtered to one page or device answers a different question from an unfiltered property total. Keep this context in screenshots, client reports and social graphics. If someone receives the chart without the presenter, they should still be able to understand what was measured.
Choose a comparison that answers a real question
Equal-length periods are a sensible starting point for an operational review. Use completed periods and note anything that could affect demand: seasonality, holidays, promotions, outages or a change in product availability. A longer comparison can add context, while a year-over-year view may help a seasonal business. No date selection removes every outside influence.
Keep the comparison reproducible. Record the exact start and end dates and export the supporting view. Do not compare a partial week with a full month or quietly change a filter between screenshots. If the newest data is still preliminary, say so or wait before drawing a conclusion. A clear limitation is more useful than a confident interpretation of incomplete data.
A verified example: BumpNDrive's search clicks
The verified Bridge comparison for BumpNDrive shows Google search clicks increasing from 344 during August 20–September 16, 2026, to 428 during September 17–October 14, 2026. That is 84 additional clicks, an increase of approximately 24.4%. Search impressions declined during the same comparison. Both facts belong in the explanation.
The separate 42,340 figure represents total Google search impressions across August 13–October 14, 2026. It is not a daily traffic count and does not represent 42,340 website visitors. This evidence does not establish a zero baseline, a sales increase, a conversion rate or a causal explanation for the click change. We describe the observed search performance and keep those limits attached to it.
Move from a site total to a useful investigation
After reviewing the headline trend, ask which pages and search queries changed. Separate searches for your business name from searches describing a service or product where practical. Look for customer needs you can serve, not simply phrases with the most impressions. A local contractor may learn more from a relevant service query than from a broad question it cannot profitably address.
An increase in clicks alongside lower impressions can have several explanations. The mix of queries may have changed, or different pages may be earning attention. It does not automatically prove that all rankings improved. Inspect the affected pages, their offers and the query context before deciding what to change. Average position is a diagnostic clue, not a promise that every searcher sees the same placement.
Finish the review with one business action
Search clicks and analytics sessions measure different things, so they should not be expected to match exactly. Use website analytics, subject to consent, to understand activity after arrival. Use inquiry records to assess whether the website generated suitable conversations. Search Console alone cannot tell you whether a submitted estimate became a paid job.
Choose one supported next action: improve an unclear service explanation, add a missing compatibility answer, investigate a technical issue or leave a useful page stable while collecting more evidence. Put the action and its review date in the worksheet. A monthly report is valuable when it makes the next decision clearer. It does not need to make every number look positive to demonstrate honest, competent work.
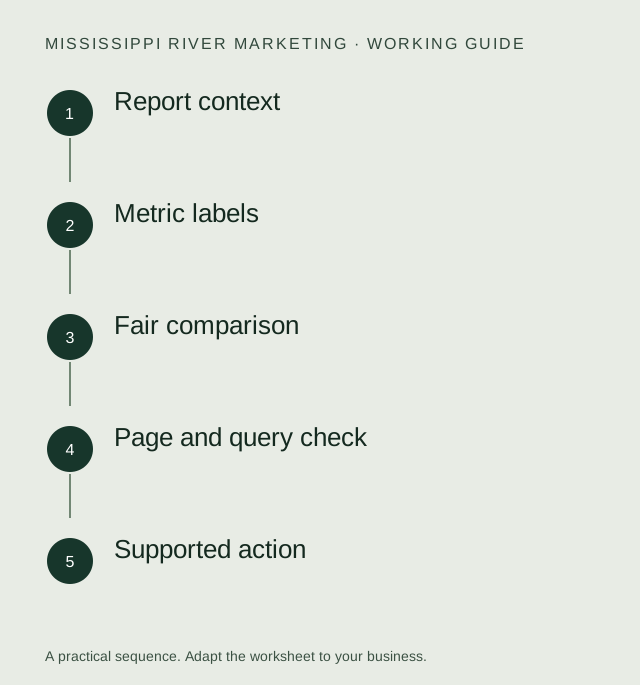
Search performance review worksheet
Keep dates, metrics and limitations attached to every comparison. The first row contains the verified BumpNDrive click comparison; the hypothetical row illustrates a possible action only.
Free CSV template for Excel, Google Sheets or Numbers. Illustrative examples are labeled; verified data includes dates and limitations. Keep customer or account details out of files you share publicly.
Primary references
- Google Search Console Help: Performance report setup and reporting
- Google Search Console Help: impressions, position and clicks
- MRM: verified BumpNDrive results and evidence
Platform documentation can change. Use the linked primary sources to confirm account-specific settings.
Need a hand putting it into practice?
We can review the gaps with you and agree on the work worth doing first.
Explore Bridge reporting →