
BumpNDrive: more Google search clicks, with the full context.
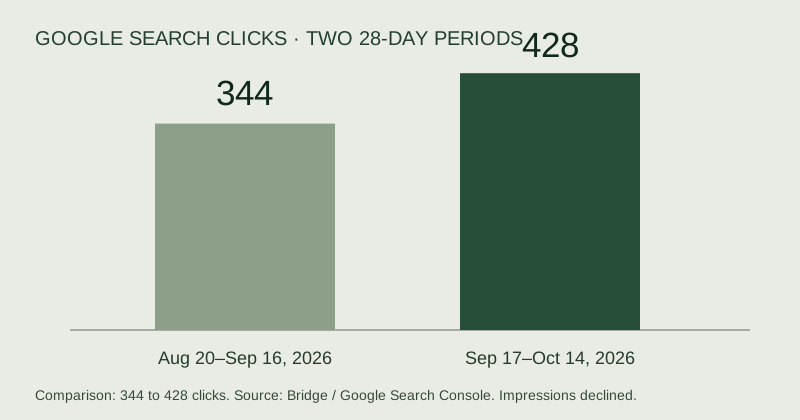
Clicks increased from 344 to 428 across two consecutive 28-day periods. Here is exactly what that tells us—and what it does not.
- Business
- BumpNDrive
- Measurement
- Google Search Console data reported through Bridge
- Comparison
- Aug 20–Sep 16 vs. Sep 17–Oct 14, 2026
A fair comparison starts with the dates.
Both windows contain 28 days. Comparing equal-length periods helps avoid a simple mismatch in reporting length. It does not control for seasonality, demand, competition, changes to search results or every other factor that can affect performance.
What improved.
Google search clicks increased by 84. The calculation is (428 − 344) ÷ 344 × 100 = 24.4186%, rounded to 24.4%. This measures clicks from Google search results during the stated periods.
What did not move in the same direction.
Search impressions declined during this comparison. An impression is an appearance in search results; it is not a website visit. The exact impression counts for these two periods were not supplied, so they are not shown as a numerical chart.
Keep the larger number in its proper window.
The reported 42,340 figure is total search impressions across August 13–October 14, 2026. It covers a different reporting window. It is not daily website traffic, and it cannot be compared directly with either 28-day click count.
What this evidence does not establish.
This comparison does not establish revenue, sales, conversion rate or which specific change caused the increase. Those conclusions need additional measurement. There is no invented zero baseline and no claim that every visibility metric grew.
The next useful step.
Review the queries and pages behind the clicks, confirm that visitors can find the relevant products or services, and verify that inquiry or purchase measurement is working. A useful report should lead to an action that can be checked later.
Inspect the comparison yourself.
Download the exact figures, dates and caveats used on this page. No modeled traffic or estimated revenue is included.
Download the source table ↓Want reporting you can understand?
Tell us what your business does, where you work and what is getting in the way. We’ll start with the problem and scope the work from there.